Thursday, September 29, 2005

Empty Spaces: Part III

The '99-'05 A's


YearTotal
Att.
Att. Stnd.WinsLossPct.AL
West Stnd.
Avg. Batting AgeAvg.
Pitching Age
Total PayrollMedian
Salary
19991,434,61012th
out of 14
8775 0.537228.731.4$24,150,333$462,500
20001,603,74411th
out of 14
9170 0.565DIV 127.129.5$32,121,833$400,000
20012,133,2777th
out of 14
10260 0.630WC
2
27.128.0$33,810,750$350,000
20022,169,8118th
out of 14
10359 0.636DIV 128.427.4$40,004,167$812,500
20032,216,5966th
out of 14
9666 0.593DIV 128.127.4$50,260,834$1,032,500
20042,201,5167th
out of 14
9171 0.562229.628.4$59,425,667$1,357,500
20051,927,2018th
out of 14
84680.553N/A28.9*28.1*$55,425,762$591,667
*:
Not Weighted


1999 marked the beginning of a new era in A’s baseball. With the emergence of rookie starter Tim Hudson and first-baseman Jason Giambi, it was the first season that the A’s were over the five-hundred mark since 1992. It also had the highest attendance figure since 1993. With the winning season of 1999 followed up by a division championship in 2000, the A’s attendance went up by 200k each year. And in 2001, the A’s crossed the 2 million-plus attendance figure since 1993. And with the winning, came the playoff berths.

Oct.
'00

TIME

OPPONENT

REC

ATT

Tue.
3

5:05

NY
Yankees

1-0

47,360

Wed.
4

5:05

NY
Yankees

1-1

47,860

Fri.
6

5:05

at
NY Yankees

1-2

56,606

Sat.
7

4:30

at
NY Yankees

2-2

56,915

Sun.
8

5:05

NY
Yankees

2-3

41,170

Oct.
'01

TIME

OPPONENT

REC

ATT

Wed.
10

5:05

at
NY Yankees

1-0

56,697

Thu.
11

5:05

at
NY Yankees

2-0

56,684

Sat.
13

4:30

NY
Yankees

2-1

55,861

Sun.
14

1:30

NY
Yankees

2-2

43,681

Mon.
15

5:05

at
NY Yankees

2-3

56,642

Oct.
'02

TIME

OPPONENT

REC

ATT

Tue.
1

1:05

Minnesota

0-1

34,853

Wed.
2

1:05

Minnesota

1-1

31,953

Fri.
4

1:05

at
Minnesota

2-1

55,932

Sat.
5

10:05

at
Minnesota

2-2

55,960

Sun.
6

1:05

Minnesota

2-3

32,146

Oct.
'03

TIME

OPPONENT

REC

ATT

Wed.
1

7:05

Boston

1-0

50,606

Thu.
2

1:05

Boston

2-0

36,305

Sat.
4

5:05

at
Boston

2-1

35,460

Sun.
5

10:05

at
Boston

2-2

35,048

Mon.
6

5:05

Boston

2-3

49,397


If you look at the attendance numbers of the 2002 ALDS vs. the Minnesota Twins, the A’s could not attract people to the park solely based on their making the playoffs. But a circumstance to consider is that all the A’s home games during that series were played in the day time and that the final game on Sunday was played when the Niners were at home playing against the A’s for the same time slot and the Giants were going to play their playoff game at 4:30. There was also the issue of the ticket pricing; the cheapest seat for the 2002 division series was $35 dollars.

Now that the A’s have had seven straight years of winning seasons, apparently, that is not enough for the casual fan in the Bay Area. The A’s have already been labeled as chokers due to their playoff collapses and as such, it could be that the A’s have seen drop-offs in both the 2004 and 2005 season because of the stigma.

It’s well known that the A’s draw well when their opponents are top-draws like the Yankees and the Red-Sox. But if you look at the attendance numbers this year, you can see a correlation between winning and the attendance per game:


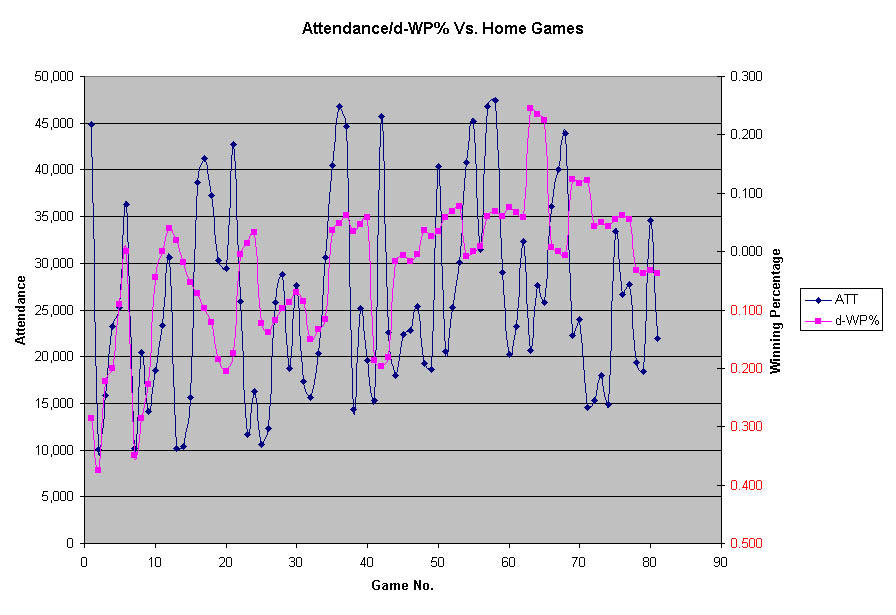
(Note: Click chart for larger image)


The first series is the Attendance numbers through games; the second is the difference in winning percentage between the A’s and their opponents, or d-WP%. When the winning percentage was -.100 or less, the attendance was very low and conversely, the attendance was low when the d-WP% was +.100 or more. The only times the numbers deviated were due to noted events such as promotions on these games. So even though the A’s had a winning season in 2005, they could not draw by solely on their merits.

Saturday, September 24, 2005

Empty Spaces: Part II

The '93-'98 A's


1993 and ’94 were tough years for the A’s from an on-field perspective, but the attendance was better than the team’s performance. Even though the team winning percentage of .420, the A’s still drew 2 million+ fans. In 1994, the A’s brought back free-agent Rickey Henderson and with attendance climbing as the team started to climb in the standings after a horrible start, all would be for naught. The season stopped on August 12th because of the labor strike and coupled with the losing record, there was a significant negative impact on the following season in regards to fans coming to see the team.

Year

Total
Att.

Att.
Stnd.

Wins

Loss

Pct.

AL
West Stnd.

Avg.
Batting Age

Avg. Pitching Age

Total
Payroll

Median Salary

19932,035,02511th
out of 14
6894 0.420728.230.9$35,565,834$575,000
19941,242,69213th
out of 14
5163 0.447229.229.8$33,169,500$413,500
19951,174,31012th
out of 14
6777 0.465429.630.9$35,961,500$235,000
19961,148,38014th
out of 14
7884 0.481328.227.1$19,404,500$152,500
19971,264,21814th
out of 14
6597 0.401428.127.8$21,911,000$194,000
19981,232,34313th
out of 14
7488 0.457428.831.0$20,063,000$270,000


Yet the A’s had no problems finding someone to buy the team. When Steve Schott and Ken Hoffman purchased the A’s from the late Walter Hass in the winter of 1995, they purchased a team that was barren in the minors and full of deferred moneys. Simultaneously Al Davis, owner of the former Oakland Raiders and then-current LA Raiders, could not acquire a new stadium in Brentwood, a suburb of LA. So as Schott and Hoffman prepared renovations for the Coliseum, Davis decided to move back to Oakland and the Oakland-Alameda Sports Authority welcome the team with open arms. As part of the agreement, the Coliseum was to be renovated with a massive structure in center field to provide maximize the capacity for football games.

Frustrated that their new investment would suffer from an un-pleasant to the eye surrounding, Schott and Hoffman sued the city of Oakland for $48 million dollars because they felt that they had incurred diminished value for their investment. They won the arbitration suit but there were to be no renovations from the ownership group.

So with a drastically changed ballpark, the A’s could not bank on the ballpark itself to bring people in. And what was once a pitchers’ park now became more neutral with nooks and crannies along the outfield wall. In order to get attendance up the team would have to win; naturally, that’s easier said than done.

SEASON
TEAMGABRH2B3BHRRBIBBSOSBCSAVGOBPSLGOPS
1993Oak27841628609242119010.3330.4670.7261.193
1994Oak471352634309253740000.2520.4130.4740.887
1995Oak104317758713039908877110.2740.4410.6851.126
1996Oak13042310413221052113116112000.3120.4670.7301.197
1997Oak1053664810424034815898100.2840.3830.6281.011


While McGwire had produced well, he played a limited number of games from ’93 to ’95 because of a reoccurrence of plantar facisitis. 1996 marked the best season for McGwire as he helped create a credible offense; unfortunately, the pitching was utter crap to the point that the A’s had 12 pitchers with at least one start. On top of that, McGwire was traded in July of 1997 after the A’s decided they would not re-sign the soon-to-be free agent. The problem was that the A’s front office decided that they could not trade McGwire earlier in the season for fear that it would alienate the already-hurting fan base. But by waiting so long to trade McGwire, the return would be small, as teams would not give up the farm for a free agent.

To start the 1998 season, the A’s add Ken Macha as bench coach and Dave Hudgens as hitting coach to round out a coaching staff that included Rick Peterson as pitching coach, Ron Washington as third base coach, and Brad Fisher as the bullpen coach. Although this would become the coaching core for the future, it could not stop the snowballing effect the A’s had with failure. In this time period, the A’s had some of the worst stretches in comparison to other teams' attendance figures. From 1993 to 1999, the A’s were no higher than 11th in the American League in total attendance. But from failure, there would be a resurgence the A’s and fans had not seen since 1987.

Friday, September 23, 2005

Empty Spaces: Part I

"What shall we use to fill the empty...
Spaces where we used to talk..."
- Pink Floyd

There have been a lot of complaints about the lack of attendance with the Minnesota Twins series as the focal-point. The complaint is basically: "How can attendance be so low when a team is in the thick of a playoff race?" But what people forget is that unless the A’s show something tangible to the casual fan, such as moving past the first round or having a superstar player, people will not go out to just see a winning team. They have seen that for the past 6 years and the A’s have nothing to show for it. Not to mention the amount of roster turnover that prevents casual fans from having a player to cling on to. But when the A’s do retain players, they aren't high-impact players like Bonds, A-Rod, or Guerrero. In a three-part series, I will examine the modern era of A's Baseball analyizing connections between their play, roster make-up, and attendance.

The '87-'93 A's


Many point to the fact that the A’s had high attendance figures in late 80’s/early 90’s as a reason that if you build a winner, the fans will come. But if you look closer, you will notice that the team was a collection of older players who the A's could not keep throughout the 90's without seeing a drop-off in talent. So while the A's were able to see a spike in attendance, the play of the team past 1992 was horrible and because of the long-term contracts of the players, they could only eat the contracts.

YearTotal
Att.
Att.
Standings
WinsLossPercentageAL
West Standing
Avg.
Batting Age
Avg.
Pitching Age
Total
Payroll
Median
Salary
19871,678,92111th
out of 14
81810.5003rd
of 7
27.728.1N/AN/A
19882,287,3357th
out of 14
10458 0.642AL 128.128.1$11,380,183$377,500
19892,667,2252nd
out of 14
9963 0.611WS 129.330.0$14,602,999$375,000
19902,900,2172nd
out of 14
10359 0.636AL 129.231.7$19,987,501$272,500
19912,713,4933rd
out of 14
8478 0.5194th
of 7
29.930.9$33,632,500$900,000
19922,494,1604th
out of 14
9666 0.593DIV 130.332.0$39,957,834$680,000
19932,035,02511th
out of 14
6894 0.4207th
of 7
28.230.9$35,565,834$575,000
19941,242,69213th
out of 14
5163 0.4472nd
of 4
29.229.8$33,169,500$413,500
19951,174,31012th
out of 14
6777 0.4654th
of 4
29.630.9$35,961,500$235,000


If you look at the major strength of the 1989 World Series team, you would see that pitching was the main core that the team kept together, even though their ages were on the wrong side of thirty. It also happened to be the biggest chunk of money of the total payrol;, about one-third of the payroll from 1991 to 1995.


  • Dave Stewart moved on to Toronto after the A’s lost to them in the ’92 ALCS. Although he could not pitch with the Jays to the level he had in Oakland, the A's brought him back in 1995 where he would have a 6.89 ERA in 81 innings as a thirty-eight-year-old.


  • Mike Moore could only duplicate his success one more time in 1991 with a 2.96 ERA in 210 innings. Moore left the A's at the age of 32 in 1992.


  • Bob Welch, the 1990 CY Young winner, suffered a season-ending elbow injury in August of 1992. He was retained until 1994 at the age of 37.


  • In an attempt to update the rotation on the fly, the A's traded for the 30 year old Ron Darling in 1991 and signed him to a 4-year, 9.7 million dollar contract in the offseason. 1992 was his only good year posting a 3.66 ERA in 206.3 innings. He left the A's after the 1995 season at the age of 34.


  • Even Dennis Eckersley could not avoid age as he fell off the table in 1993 at the age of 38, posting a 4.16 ERA in 67 innings; a far cry from the 1.91 ERA in 80 innings of the '92 season. He would leave the A's after the '95 season at the age of 40.

So without pitching, the A’s were guaranteed to fail in 1993, the first season where their roster was virtually changed from head-to-toe. So without a winning team, and no real connection of the fans to the plethora of stars the 1987-1992 teams had, the A’s needed a corner-stone player to step up and help to create a new era. In 1992, Barry Bonds, formerly of the Pirates, became a free agent and signed a six-year contract with the Giants that would pay him $43.75 million. Of course, if the A's weren't locked into their contracts that they payed solely out of wanting to keep a core together, they could have easily afforded Bonds.

But the A's had someone who could fill the job: Enter Mark McGwire.

In the next post, I will talk about the '93-'98 A's.

Posts coming soon

Just a head's up: By tommorow, I should have two posts up: one regarding the attendance issue of 2005 and the past; another regarding the bullpen.

Monday, September 19, 2005

More fun with spray charts!

While I was watching this Boston series, I noticed that Dan Johnson had been really struggling as of late. So let's delve into to some analysis:

GABRH2B3BHRRBITBBBSOSBCSAVGOBPSLG
vs
Left-handed Pitcher
912320001233000.1670.3330.167
vs
Right-handed Pitcher
17493700251348000.1430.2080.265
Home624250001517000.2080.2400.208
Away11374400251064000.1080.2330.270
Day519130000314000.1580.2000.158
Night12425600261267000.1430.2500.286
Sept.
Total
176169002615711000.1480.2350.246


Besides the slide he is having this season, two important points: he has 5 GIDP's for September and July 21st was his last off-day. His amount of GIDP'S is one less than Kendall's, who happens to lead the league. And that he has played in so many games in a row is indicative of the trait amongst the A's 3-6 hitters.

With that in mind, is there a possible mechanical problem with Johnson? Let's look at his spray chart for this month:

(Note: Hits are solid circles, Outs are X's)


As you can see, alot of his hits have gone to left field. Of the nine hits he has this month, 7 have been pulled to right field. In fact, the last time he went opposite field for a hit was on the 7 of September.

Johnson is pulling on the ball and this is because of a change in the way opponents pitch to him. Durring an A's telecast, Johnson mentioned as much and that he has changed his approach as they are throwing far more inside to him and with more offspeed pitches. What has happened though is that he is gearing up for the offspeed pitches so much that he is barely catching up to the fastball causing him to lose his ability to place good contact on the ball.

Hopefully, someone drills in to his psyche that he needs to think opposite field and try to hit the pitches where they are thrown. Another issue is that Johnson has been taking more pitches for strikes even though they are pitches he could hit:

"It's very frustrating," Johnson said. "In hindsight, I would have bunted. I took two pitches that I probably should have swung at. Then he snuck a fastball in there. I just rolled it over for him."


Frankly, Johnson needs to be one cool cat; perhaps he could channel Don Johnson's tv character, undercover cop Sonny Crockett...

Saturday, September 17, 2005

The Company Man


Here's Adam Melhuse, a 33-year old backup catcher who has played that role his entire career. The A's signed Melhuse to a one-year contract after he became a six-year free agent. When the A's let Damian Miller go last year, Melhuse was thinking "hey, this is my shot for a full-time gig." However, Beane said not so fast and acquired Jason Kendall. Once he received word, Melhuse asked to be traded but was denied by Beane.

Melhuse appeared in 69 games last year, and his agent hoped for a situation where Melhuse could compete for the everyday job or share it.

The agent will ask the A's if he can shop his client to a team that would give Melhuse more playing time.


"Adam was the backup the last two years and did a great job," Beane said. "We're very happy with him in that role."

Seeing as how the A's have yet to add Melhuse into the lineup, I am surprised that Melhuse didn't look at what Jay Payton did, fighting with Boston manager Terry Francona, as an answer. So why didn't Melhuse go off in August about not playing enough and forcing the A's to move him because of disruptive failure? Well it could have something to do with that he played in 7 full games, the highest amount in any month prior to that. But it is because Melhuse has been a real company man and has come to ease with being a seldom-used backup.

So where do you play Melhuse? How about for the slumping DH? I know, I know, I should ease up on Hatteberg. Ok, no problem; I acknowledge that Hatteberg has been run down. He has played in 23 straight games and for a player of his age, that is just asking for disaster. Not only that, but Johnson hasn't had a day off since July 21st, and Chavez hasn't had a day off since August 23rd. So if the A's don't want to disrupt Mr. Kendall, why hasn't Melhuse played a few games at DH, and for a game move Hatteberg to 1st and possible move Melhuse to third for a game? Melhuse came up as a third baseman and while playing him there, you can get his bat into the lineup unlike playing a lesser bat like Ginter. Melhuse is a switch hitter after all and he hasn't had enough AB's to really say that he does not perform well from that side. In fact, he has a mirror-image stance while he bats right handed.

So what could be the reason as to why the A's are so reluctant to play Melhuse? Well, after looking at his arbitration status, Melhuse is arbitration eligible after this season. By not playing Melhuse, they are able to save money when it comes to agreeing to a contract for 2006. There is no other explanation for not playing him when you have Kendall catching more games than necessary and thereby risk him becoming a dead contract.But you are probably saying to yourself: "self, that just sounds like a big ol' conspiracy." Well, chew on this: When Melhuse was going off with the bat in July and August, Macha was talking about getting a third catcher, but Beane said no:

The situation, however, might change down the stretch. General manager Billy Beane has said there are no plans to add a third catcher, which would free up Macha to put Melhuse and Kendall in the lineup on the same day without worry. But Macha admitted that he's given some thought to playing them at the same time, anyway.


Even though Macha still thought about using him at the same time, the decision was made for him by the front office.

In Ellen Goodman's short-story, "The Company Man", a tale is woven about the death of a "company man..."

"At the funeral, the sixty-year-old company president told the forty-eight-year-old widow that the fifty-one-year-old deceased had meant much to the company and wouild be missed and would be har to replace.

...


By 5:00 P.M. the afternoon of the funeral, the company president had begun, discreetly of course, with care and taste, to make inquiries about his replacement."


Melhuse has had one year of his life, wasted because he is a "company man." Hopefully for the A's and Melhuse, he goes the route of Greg Zaun and finds a resurgence in his career by becoming a full-time catcher.

Force Play

"But it's too late baby, now it's too late...
Though we really did try to make it"
- Carole King


Last night's game exposed the A's weakness; if the Duke has to relieve a starter in the 7th inning, you are likely to not win an extra innings game. When the bottom of the 10th inning rolled around, with the game tied, it made a lot of sense to go with guys who could go multiple innings.

Allowing Juan Cruz to start the inning against a righty was a huge advantage for him but he was unable to put Tony Graffinino away. At that point, with Johnny Damon up, I would have gone with lefty Ron Flores who could get you a ground ball with his little breaking piece.

But once Macha left Cruz in to face Damon, I knew then that the options were limited. Thankfully, Damon didn't decide the game although putting Graffinino on third sucked. So now, you have Edgar Renteria, and at that point, you have to bring in someone else; Cruz has already been tagged twice. Even though Renteria is in a huge slump, so has Cruz, and I would trust Renteria to break out of a slump than for Cruz to.

At that point, that very point, is when Macha lost the game. You have to get someone like Keiichi Yabu in there to get you the groundball. Unlike Cruz, Yabu has sinking pitches like his awesome splitter. But Macha left Cruz in and Renteria was hit by a pitch. That AB was very crucial and was WORSE than Yabu hiting Manny Ramirez. Pressure wise, the situation was far less for Cruz and yet he still hit Renteria.

Now you know that Cruz is a major headcase and any crap about him wanting to stay in but "he doesn't make the decisions," is completely false. Cruz forced Macha to make the decision for him by hitting Renteria.

Many have brought out Macha's recent quote on playing about the win; at that point in the game, he's worrying about avoiding the loss. The way the A's bats have been swinging, putting Street in that inning would not have guaranteed him a win. He would have to go at least, at least two innings if the A's scored and that's very optimistic with Kendall, Kotsay, and Chavez,(Kotsay and Chavez: 1-8 combined), due up in the next inning. And if the A's didn't score, you would have to use Cruz, Yabu, Flores, Witasick or Garcia to close out the game in Fenway.

Yabu was the right decision, but it came two batter late.

Friday, September 16, 2005

"The bravery of being out of range" - Roger Waters

Many have said that Jason Kendall has gotten back the stroke that made him an All-Star catcher; Macha had preached this to whomever would listen. But after watching this month's games, I realized that, in my opinion, he really isn't setting the world on fire. Sure he has had a nice September numbers wise, but how about actual performance?

First off here are his numbers for September and in contrast to his previous stats:
By
Month/Games
ABRH2B3BHRRBIBBHBPSOSBCSGIDPPIL*AVGOBPSLGOPS
April89102330011911200--0.2580.3330.2920.625
May941022600683520--0.2340.3140.2980.612
June9015273003122532--0.3000.3940.3330.728
July10312325101284410--0.3110.3730.3790.752
August1141123300765911--0.2020.2680.2280.496
Totals49058127201039431535731910.2590.3380.3040.642
DATEOPPABRH2B3BHRRBIBBHBPSOSBCSGIDPPIL*
Sep.
1
@LAA00000000000009
Sep.
2
NYY21110021101001
Sep.
3
NYY40100000000001
Sep.
4
NYY40000001000001
Sep.
5
SEA40000000000002
Sep.
6
SEA

Did
not play

Sep.
7
SEA52200000000002
Sep.
9
@TEX43310001000002
Sep.
10
@TEX40200000010002
Sep.
11
@TEX40200000000022
Sep.
12
@CLE40200010000012
Sep.
13
@CLE40000000000012
Sep.
14
@CLE40000000110002
Sep.
15
BOS51210000000012
ABRH2B3BHRRBIBBHBPSOSBCSGIDPPILAVGOBPSLGOPS
Sept.
Totals
48715300332210520.3130.3770.3750.752
*PIL
= Position in Lineup


If you notice, he has been pretty consistent, unlike Hatteberg who has had three great games in the past two months and about 30 horrible ones. The problem I had had with Hatteberg was that the press was praising him for his numbers, without really looking at how those numbers were composed.

Likewise, I had felt that Kendall was sucking just as bad as Hatteberg, but that Kendall was lucky enough for the batted balls to be just out of the range of fielders. So what I decided to do was gather up a spray chart of the month of September, excluding tonight's game. My thought here was to see where his outs were made and where the hits landed. Here is what I was able to come up with:

Note: Outs are X's Hits are solid O's


The problem with the hits chart is that they are recorded not from where the ball has landed but from where the fielder has picked up the ball. For instance, if a hit was to bleed through shortstop and third-base, that hit would be recognized at the point the left fielder picked up the ball. Only if the ball is a double does it show the point of impact. This is true for all available spray charts.

So what I propose is to look where the hits are indicated in comparison to where his outs are made, with the theory being that in order for the ball to get to the indicated spots from home plate, they must travel on a straight line through the infielders. From observations of these month's games, it is fairly reasonable to assume this is the case as most of his hits have not been of the fly variety.

Looking at the general clusters, it can be seen that a lot of his hits go through areas where infielders would normally play for the double-play; as such, you will notice that in Kendall's game log above, I have included a double-play chart.

My hypothesis is that Kendall has indeed received a vast majority of his September hits when men are not on base. Here is a hit log(Word fmt.) for all 15 hits including situations. Looking at the log, ten of his hits have come when a runner was not on first, when the defense is not playing for a double play. While sample size is small, Kendall has yet to show that he is really hitting the ball with authority.

So I feel that the A's should really consider moving him down in the order perhaps ninth AND if there is a runner on first, either hit and run or have the batter steal second, thus eliminating a high probability of Kendall grounding into a double play. It's a move that just may produce more of Kendall's infamous bloop shots.